JGI Plant Gene Atlas

Gene expression across diverse plant species


The JGI Plant Gene Atlas is an updateable transcriptome resource generated from a multi-laboratory collaboration following documented growth, sequencing and data analysis protocols for a number of evolutionarily distant JGI flagship plant species. With common comparable tissues and conditions across these plants, Gene Atlas provides insights into the changes in transcriptional landscape in response to conditions across diverse plant genomes. In addition to cataloging gene expression profiles this growing resource significantly contributes to the JGI genome annotation efforts to accurately annotate genetic elements.

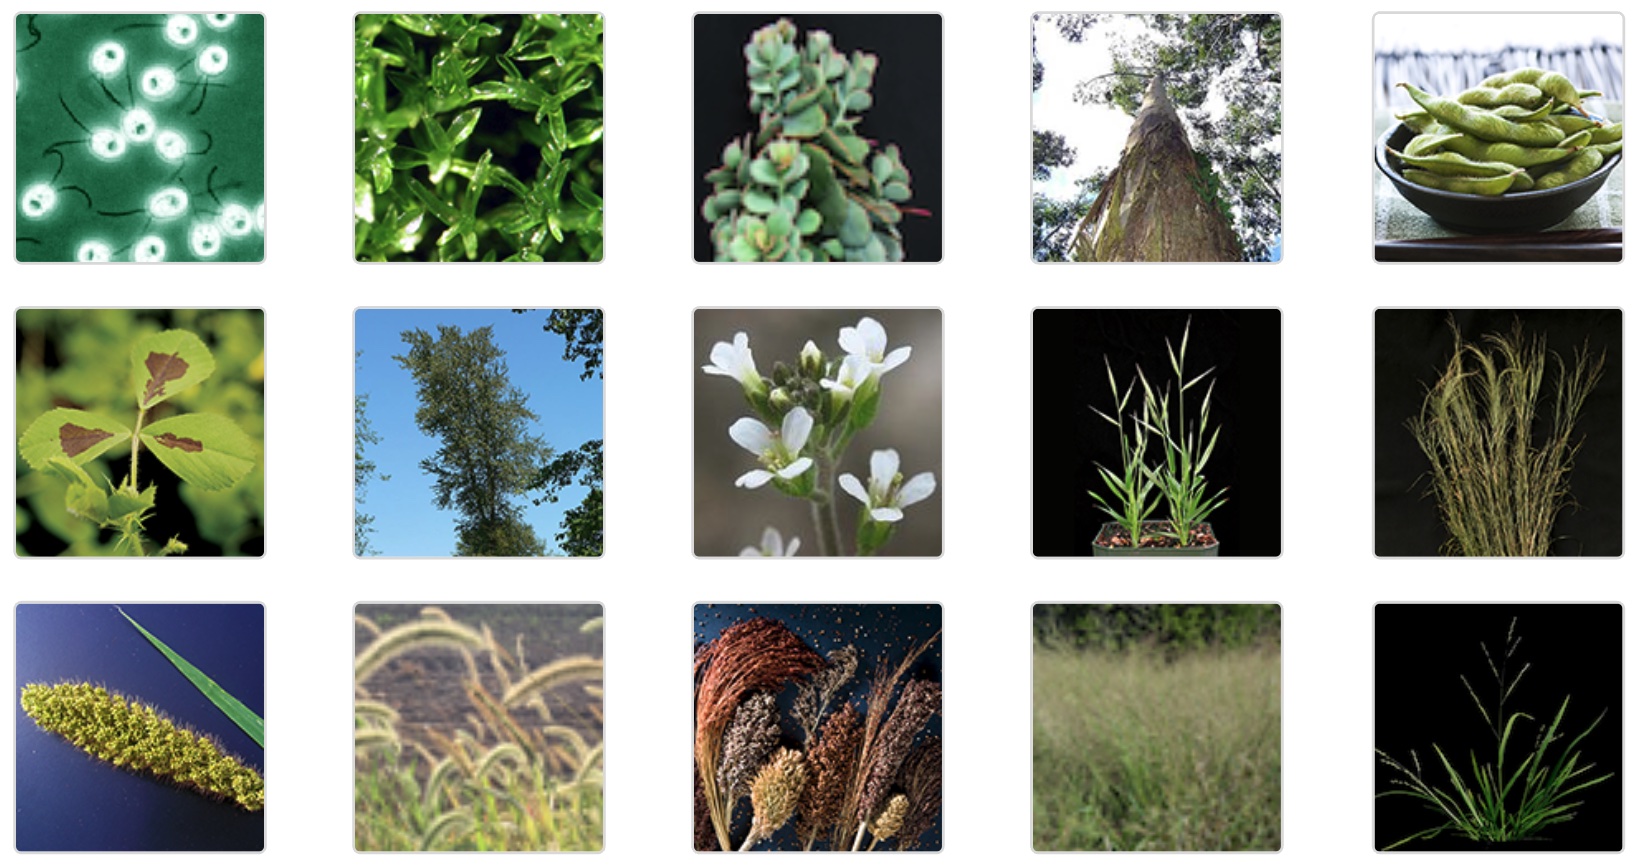
Currently, JGI Gene Atlas consists of >2,000 RNA-seq samples from seventeen JGI plant flagship genomes: Chlamydomonas reinhardtii (algal model), Physcomitrella patens (moss model), Arabidopsis thaliana (model for plant genetics and biology), Sphagnum angustifolium (aka. S. fallax) (flat-topped bogmoss), Glycine max (legume model and crop plant), Medicago truncatula (forage legume model), Populus trichocarpa (woody perennial biomass crop), Eucalyptus grandis (biomass energy crop), Brachypodium distachyon (a C3 grass model), Panicum virgatum (herbaceous perennial crop), Panicum hallii var. filipes (grass model), Panicum hallii var. hallii (grass model), Setaria italica (grain and forage crop), Setaria viridis (a C4 grass model), Sorghum bicolor (a C4 grass bioenergy crop), Sorghum bicolor Rio (sweet sorghum, Rio) and Kalanchoe fedtschenkoi (model for Crassulacean acid metabolism photosynthesis). For each of these plants, samples were collected from coordinated studies including developmental stages in Physcomitrella and sorghum, abiotic stress conditions in Brachypodium and Kalanchoe and a common comparative condition across many representative plants focused on nitrogen metabolism. These dense RNA-seq data sets further allow to compare gene expression across conditions within a plant and through orthologous gene sets across phylogenetically diverse plant genomes.

This website provides a hub for access to the JGI Plant Gene Atlas data, subject to the data usage policy.

Citing JGI Plant Gene Atlas data

Sreedasyam,A., Plott,C., Hossain,M.S., Lovell,J.T., Grimwood,J., Jenkins,J.W., Daum,C., Barry,K., Carlson,J., Shu,S., et al. (2023) JGI Plant Gene Atlas: an updateable transcriptome resource to improve functional gene descriptions across the plant kingdom. Nucleic Acids Res., 10.1093/nar/gkad616..

Contacts

  • Jeremy Schmutz (jschmutz AT hudsonalpha DOT org)
  • Avinash Sreedasyam (asreedasyam AT hudsonalpha DOT org)


The JGI Plant Gene Atlas project conducted by the U.S. Department of Energy Joint Genome Institute was supported by the Office of Science of the U.S. Department of Energy under Contract No. DE-AC02-05CH11231.
JGI, Integrative Genomics Building | 1 Cyclotron Dr., Building 91, Berkeley, CA 94720


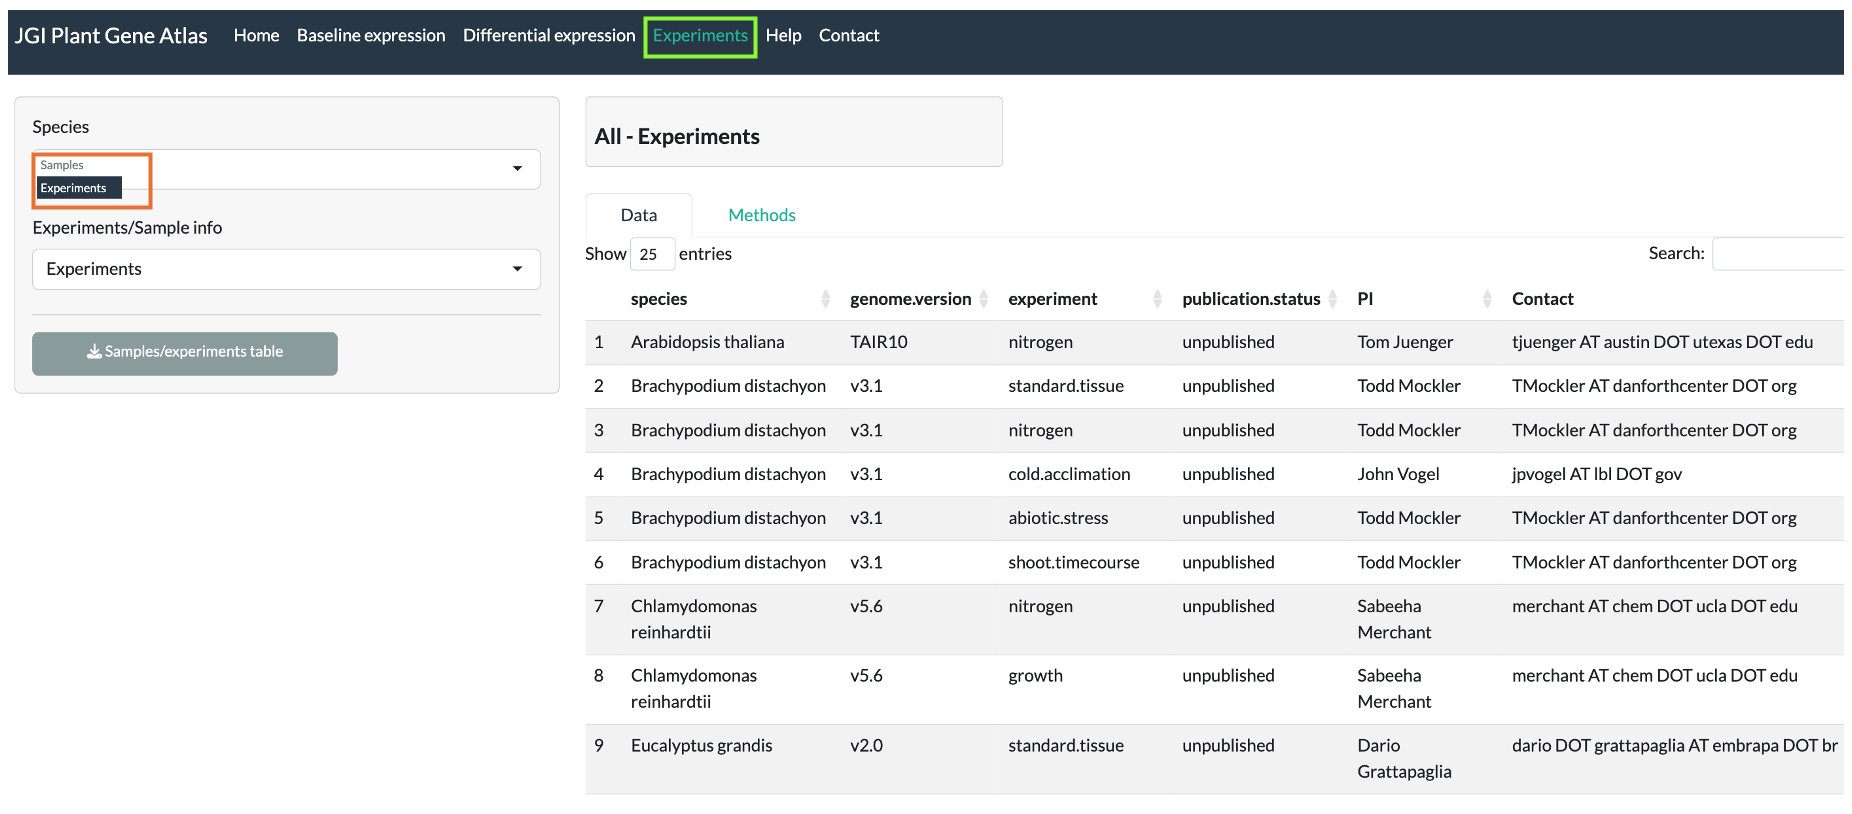
Gene Atlas experiments

Most common experiments includes but not limited to:
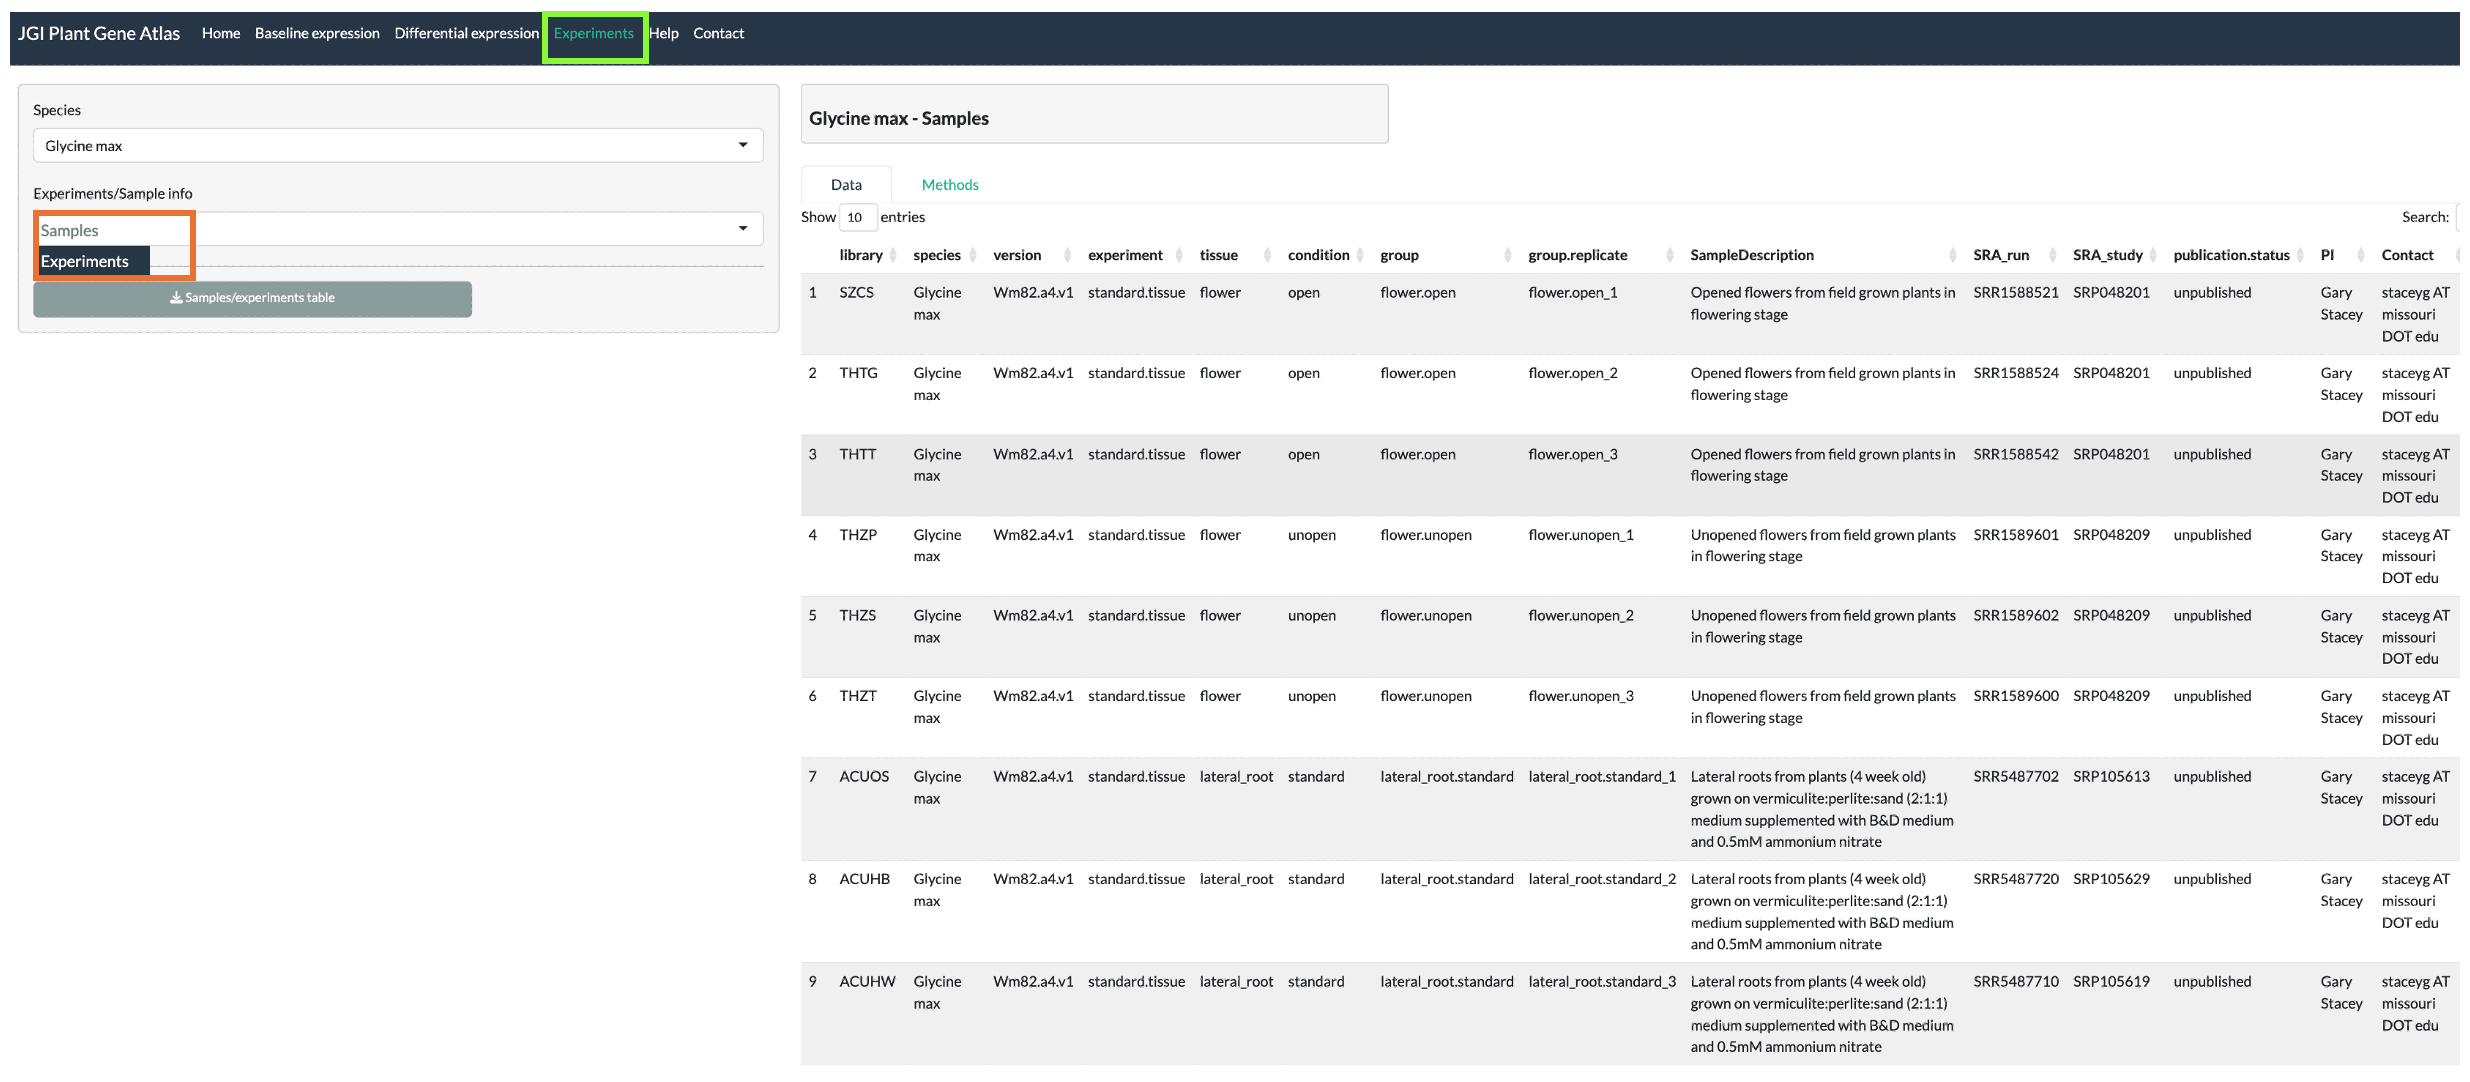
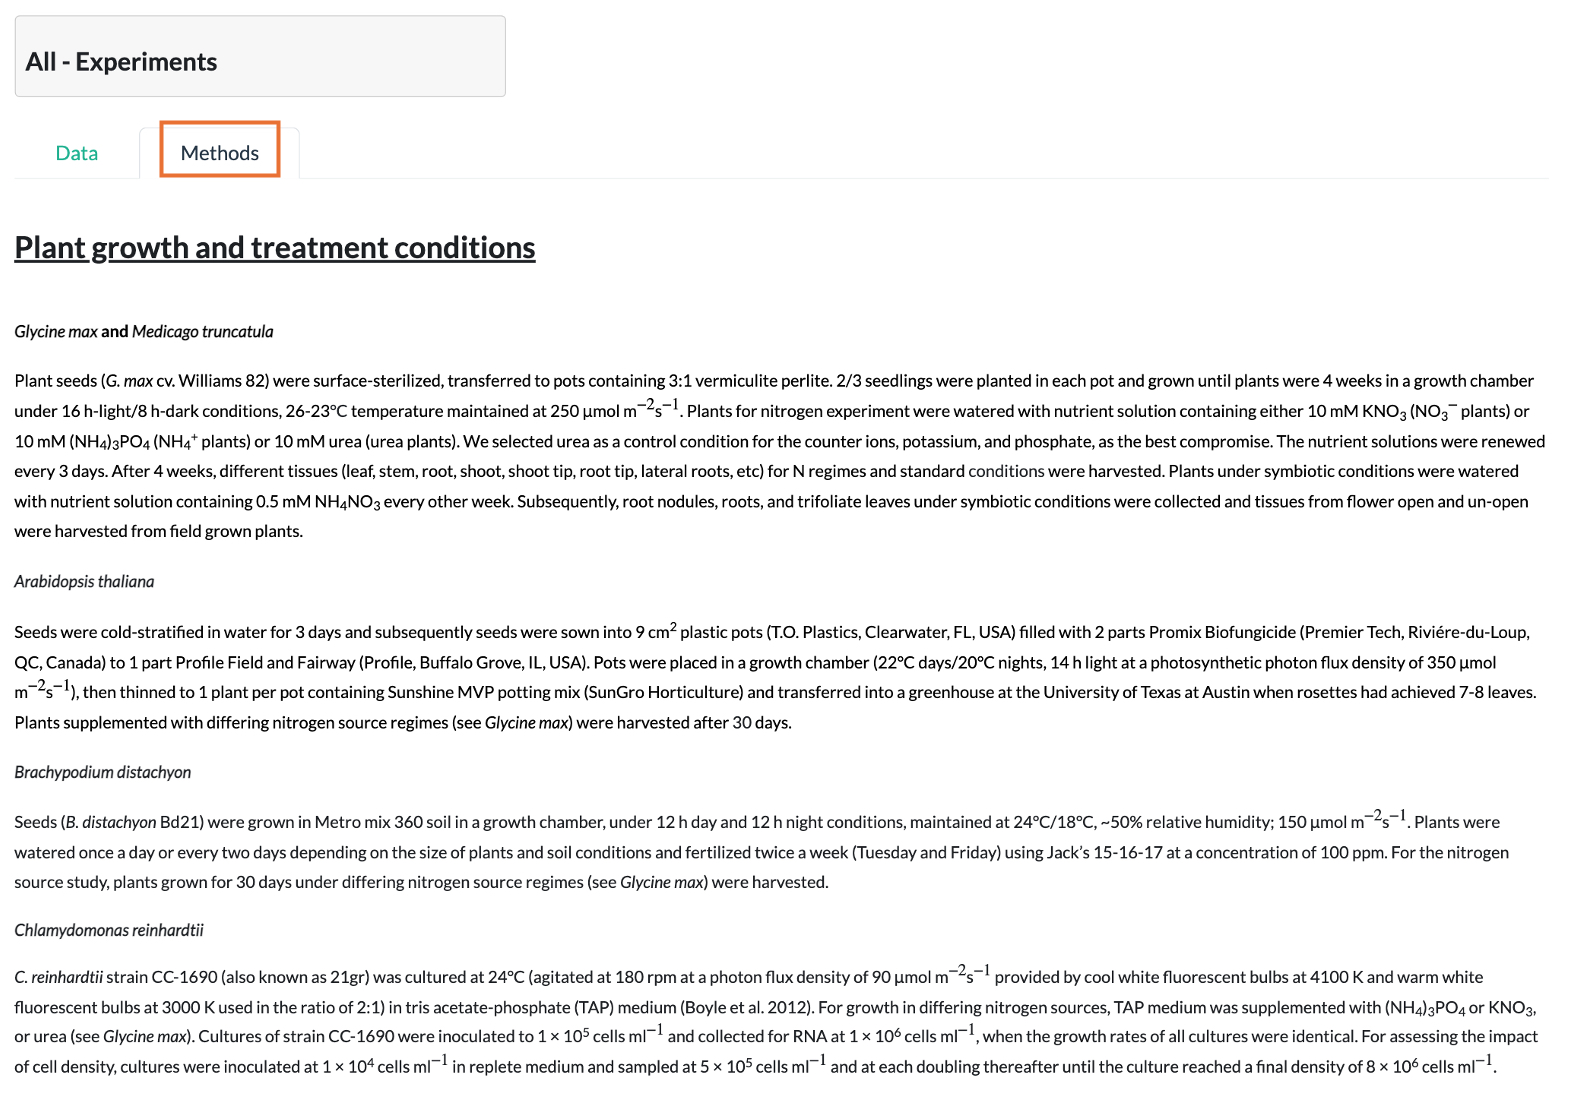
Standard tissues
Plants are grown in standard conditions in green house for four weeks and leaf, stem, roots, lateral roots, buds, and flowers are harvested.

Nitrogen experiment
Plants for nitrogen experiment are grown in green house under standard conditions and supplemented with nutrient solution containing either 10 mM KNO3 (nitrate treatment) or 10 mM (NH4)3PO4 (ammonium treatment) or 10 mM urea (urea treatment). The nutrient solutions are renewed every 3 days and leaf, stem, and roots are harvested after 4 weeks.

Harvested tissues are immediately flash frozen in liquid nitrogen and stored at -80oC for RNA extraction.


Loading...


Heatmap data
Loading...


Orthologs table

Orthologs expression

GOI expression


Loading...


Loading...


Loading...
Loading...


The JGI Plant Gene Atlas project conducted by the U.S. Department of Energy Joint Genome Institute was supported by the Office of Science of the U.S. Department of Energy under Contract No. DE-AC02-05CH11231.
JGI, Integrative Genomics Building | 1 Cyclotron Dr., Building 91, Berkeley, CA 94720

Loading...


Loading...
Loading...
Loading...
Loading...


The JGI Plant Gene Atlas project conducted by the U.S. Department of Energy Joint Genome Institute was supported by the Office of Science of the U.S. Department of Energy under Contract No. DE-AC02-05CH11231.
JGI, Integrative Genomics Building | 1 Cyclotron Dr., Building 91, Berkeley, CA 94720

Loading...
Loading...


The JGI Plant Gene Atlas project conducted by the U.S. Department of Energy Joint Genome Institute was supported by the Office of Science of the U.S. Department of Energy under Contract No. DE-AC02-05CH11231.
JGI, Integrative Genomics Building | 1 Cyclotron Dr., Building 91, Berkeley, CA 94720

JGI Plant Gene Atlas - Help


  • Baseline line expression

    • Data
    • Under data tab gene expression levels for a selected species are tabulated in the main panel. By default, expression levels (FPKM) are displayed for Arabidopsis across all available experiments.

      Filter and search genes

      You can select species and experiments available in the Gene Atlas project and narrow down the results using drop down menus in the left panel. Also, you can select FPKM or TPM expression levels.

      The tabular data in the main panel is interactive allowing one to re-order the data using sorting arrows by the column names. You can filter the content using the Search box on the right. This search works not only with Gene IDs but also with the gene function descriptions. Furthermore, selecting a gene ID or a row in the table displays the gene information (including location, function description and expression derived biological information from Gene Atlas analysis) in the top panel.


      Downloads

      Expression data, sample information and function descriptions can be directly downloaded as CSV files by clicking Download buttons in the left panel.


    • Visualize expression patterns
    • In visualization tab, you can generate a heatmap displaying top variable genes (default, 20) across selected experimental conditions. For a list of your genes of interest, you can see the variation in their expression across available samples in a particular experiment.


    • Expression profiles of orthologous genes
    • In orthologs tab you can find the expression pattern of ortholog/s of a single or multipe genes from a selected species. Here you can visualize expression profiles of both, orthologs from selected species (top) and the queried species (bottom).

      You can filter for only single copy orthologs using the check box.

      Orthologous genes, expression of orthologs and expression of your genes of interest can be downloaded as CSV files by using download buttons at the bottom.


    • Prioritized targets for future experimental studies
    • To help investigators target important genes for additional functional studies, ranked list of genes of biological relevance based on expression patterns of genes identified using a) tissue/condition specificity, b) differential expression, c) co-expression in a network module, and d) consensus expression across species are displayed and also provides download option in the right panel.


    • Analysis methods
    • A list of methods and tools used in analyzing the Gene Atlas data are included under Methods tab.


  • Differential expression

    • Data
    • For each species, you can browse differentially expressed genes (DEGs) across preset comparisons from the drop down menu.

      Radio buttons in the left panel allows to select for up- or down-regulated or both up- and down-regulated (default) genes.

      Using log2 fold-change and the adjusted p-value input boxes you can specific criteria for differentially expressed genes (default log2 fold-change > 1 and adjusted p-value < 0.05).


    • Visualize enrichment analysis results
    • Under visualization tab you can look at both Gene Ontology and KEGG pathway enrichment anlysis results as lollipop plots across sets of differentially expressed genes.

      Interactive plot check box in the left panel allows to toggle between interative (default) and static plots.


The JGI Plant Gene Atlas project conducted by the U.S. Department of Energy Joint Genome Institute was supported by the Office of Science of the U.S. Department of Energy under Contract No. DE-AC02-05CH11231.
JGI, Integrative Genomics Building | 1 Cyclotron Dr., Building 91, Berkeley, CA 94720

Contact


  • Avinash Sreedasyam (asreedasyam AT hudsonalpha DOT org)

  • Jeremy Schmutz (jschmutz AT hudsonalpha DOT org)


Project PI's


Loading...


The JGI Plant Gene Atlas project conducted by the U.S. Department of Energy Joint Genome Institute was supported by the Office of Science of the U.S. Department of Energy under Contract No. DE-AC02-05CH11231.
JGI, Integrative Genomics Building | 1 Cyclotron Dr., Building 91, Berkeley, CA 94720